
Strategy Tester
Tests a coded Pine strategy() script. A discretionary playbook is the call you make on the bar, and that call is not in the script.
Manual backtesting for TradingView
TestingView adds a backtesting session to your own TradingView layout. Replay past candles with the future hidden, take trades with TradingView’s Long and Short Position tools, and get a journal with expectancy, profit factor, and drawdown. No code.
Chrome, Edge, or Firefox, or TradingView Desktop on Windows. Free plan: 20 trades per session. Available history and timeframes depend on your TradingView plan; TestingView cannot unlock them.
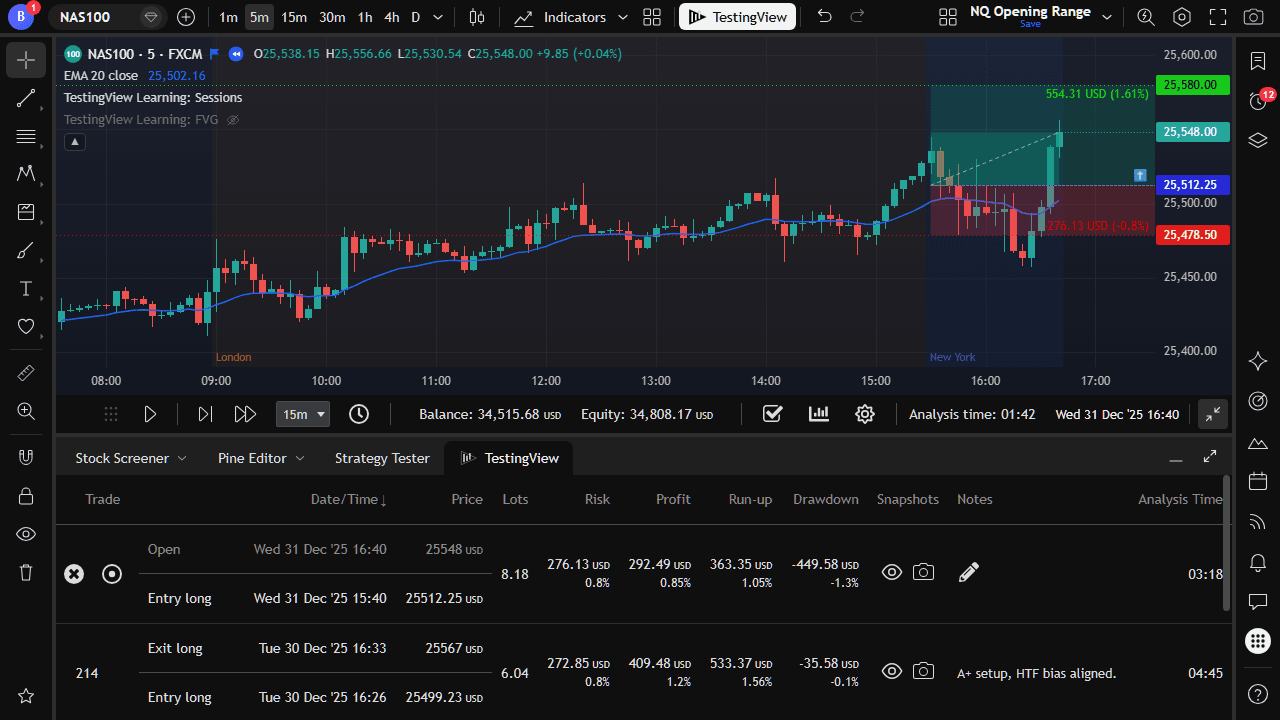
One session, start to finish
Your edge is a decision you make on the bar: take it, skip it, move the stop, go to break-even. TestingView moves you through history, keeps the record of every decision, and shows you what it added up to.
Indicators, drawings, and timeframes stay on the chart. Multi-chart layouts work too.
Set the capital you would really trade and pick a start date, or let ChronoShuffle drop you on a random day so you cannot open the week you already remember.
Draw a Long or Short Position, size it from your stop, and play the candles. The trade opens when price reaches your entry. Move the stop, the target, or go to break-even as your rules say.
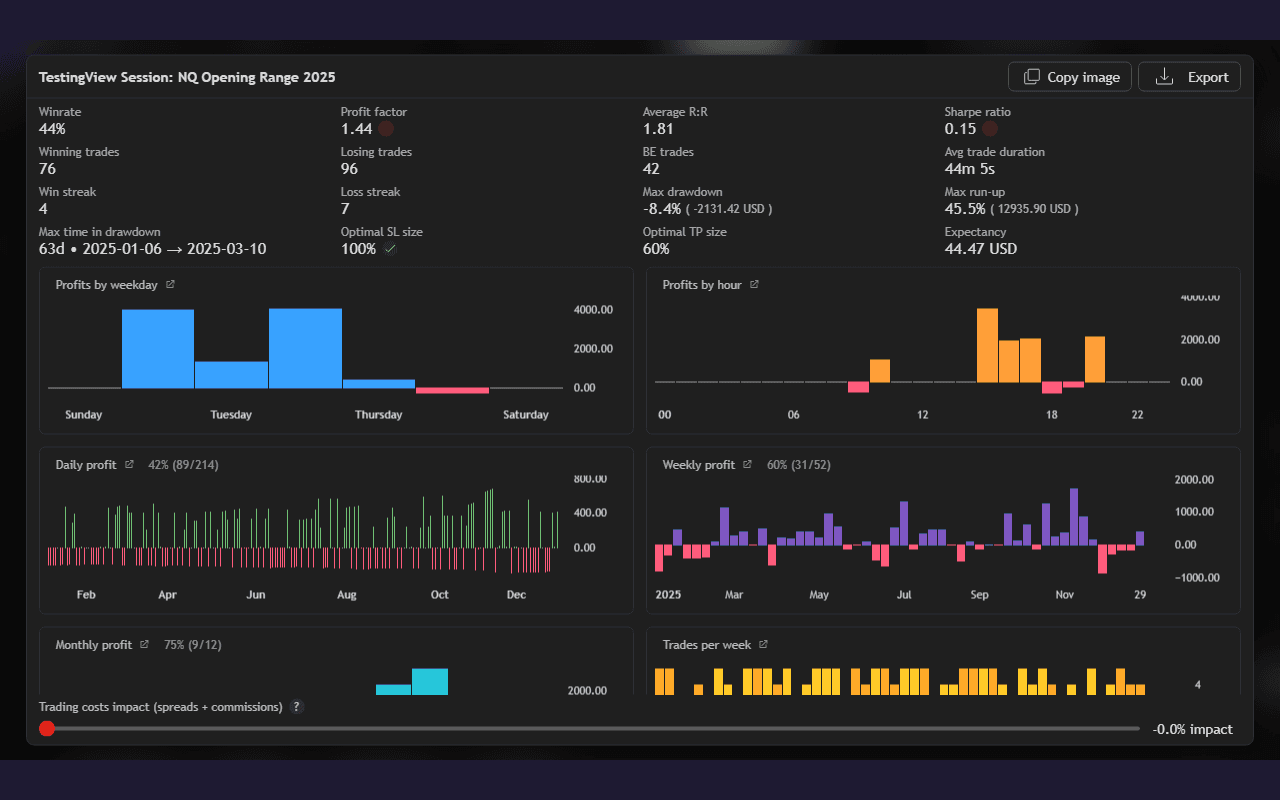
Expectancy, profit factor, drawdown, and win rate, plus the hours and weekdays that actually paid. Then check whether the drawdown would have fit the limits you trade under.
Each of them does part of the job. TestingView is for the trader whose rules live on the chart and who wants a record of how those rules performed.
Tests a coded Pine strategy() script. A discretionary playbook is the call you make on the bar, and that call is not in the script.
Steps the chart through history. TradingView’s replay trading adds simulated orders and a results summary for that replay; its help center says those trades are not saved afterward.
Works until the sample gets long. Sizing, times, run-up, and drawdown are typed by hand, and the losers are the rows that go missing.
Keeps the session balance, risk sizing from the stop, break-even rules, an automatic journal, and statistics, on the TradingView chart and indicators you already use.
Compare TestingView and TradingView Bar ReplayWhat manual backtesting is
TestingView works on the symbols and history your TradingView plan includes. Position size follows the symbol: forex lots, futures point values, shares, and crypto, with the currency conversion stored at entry.
A retail trader whose trading day happens inside TradingView. You have a saved layout, often more than one chart, and a playbook you follow. Entries are visual, and the playbook is a sequence of decisions a script would not make the same way.
Maybe you already backtest with screenshots and a spreadsheet, or in a separate app without your indicators. TestingView keeps the test on the same chart you trade.
Prop-firm candidates with a drawdown rule and a deadline. Traders who are profitable some weeks and give it back on others. Anyone deciding whether to size up.
One good week is not the answer. You keep opening the same chart, taking the setup you take live, and reading what the journal says after the next run of trades.
You want a coded strategy, a parameter sweep, and an equity curve overnight. TestingView waits for you to take the position on the chart.
A backtest needs rules to test. If there is no layout or playbook worth preserving yet, start there. On intraday charts, TradingView’s own replay limits still apply.
The workflow is one trader, one chart, one journal. The scale and the job are different.
Use the free plan to see the session on your chart. Anyone deciding whether to size up, or whether to pay for a prop-firm evaluation, needs a real sample: break-even, statistics, and more than 20 trades.
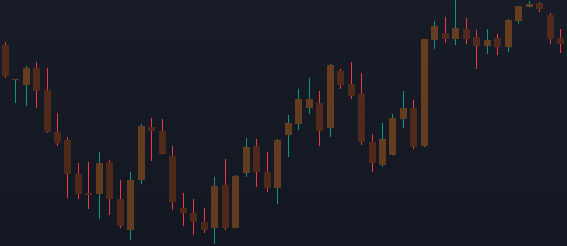
Learn the clicks. Twenty trades show the workflow.
$0
Free plan
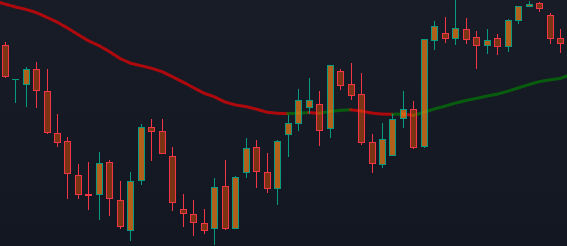
The sample: 50 trades, break-even, and stats before a prop fee or real size.
$7.99/month
7-day free trial
When the habit sticks: several playbooks, Excel, trading costs, unlimited trades.
$9.99/month
14-day free trial
Full plan comparison, trials, and billing: pricing.
Short answers for the trader who already has a chart. The full knowledge base covers playback, risk, and the journal.
TestingView is a backtesting tool that runs on top of TradingView. It adds backtesting session management, simulated position tracking, risk sizing, a journal of backtested trades, snapshots, statistics, and safer candle playback controls.
TestingView works with the TradingView account you already have. The history and timeframes you can step through depend on your TradingView plan. If your plan does not include lower timeframes in historical playback, TestingView cannot unlock that limitation.
No. TestingView does not unlock TradingView plan limits such as lower-timeframe history, extra indicators, more charts per layout, or additional historical data.
TestingView can work with TradingView symbols across common asset classes such as forex, stocks, futures, indexes, commodities, crypto, and CFDs, as long as TradingView provides historical data for the symbol on your plan.
Yes, within your TradingView plan limits. TestingView does not increase the number of indicators your TradingView account can use.
Start or resume a session, draw a TradingView Long Position or Short Position tool, set entry, stop loss, take profit, and risk/size, then play candles. When price reaches the entry, TestingView opens and tracks the simulated trade.
TestingView can show metrics such as profit, win rate, profit factor, average RR, drawdown, run-up, expectancy, streaks, equity curve, returns, and other performance charts. Some advanced statistics depend on your plan.
The current product plans are Starter, Explorer, and Trader.
Yes. Starter is capped at 20 trades per session. Explorer raises the cap to 50. Trader does not have a trade cap.
No. TestingView uses your TradingView identity for linking access, but it does not ask for or store your TradingView password.
Open the layout you trade. Start the session. Leave with expectancy and drawdown, written down.
The desktop app needs TradingView Desktop already installed on Windows. TestingView runs as an add-on to that app.