Risk management
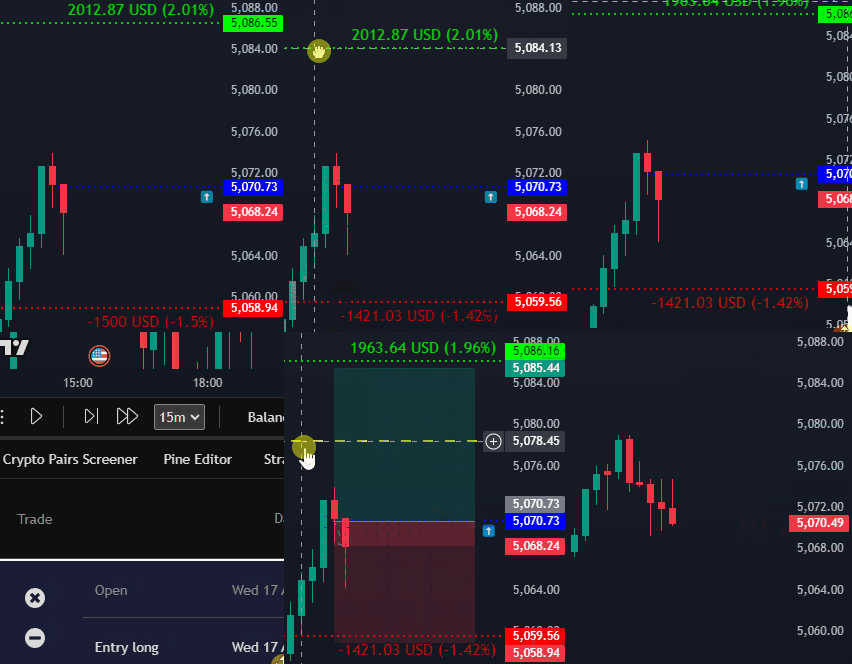
Size entries with stop loss, take profit, and risk controls that are tied to your session capital.
Backtest your TradingView strategy like it is live. TestingView is a historical candle-replay engine on the charts you already use, including your own indicators. Find and test trading strategies with sessions, simulated trades, risk sizing, a backtesting journal, and measurable statistics.
The desktop app needs TradingView Desktop already installed. TestingView runs as an add-on inside that app.
Browse sessions, customization, TradingView integration, and advanced statistics. Open the full gallery on the features page.
Backtest on TradingView with sessions, a journal, and stats that feel live.
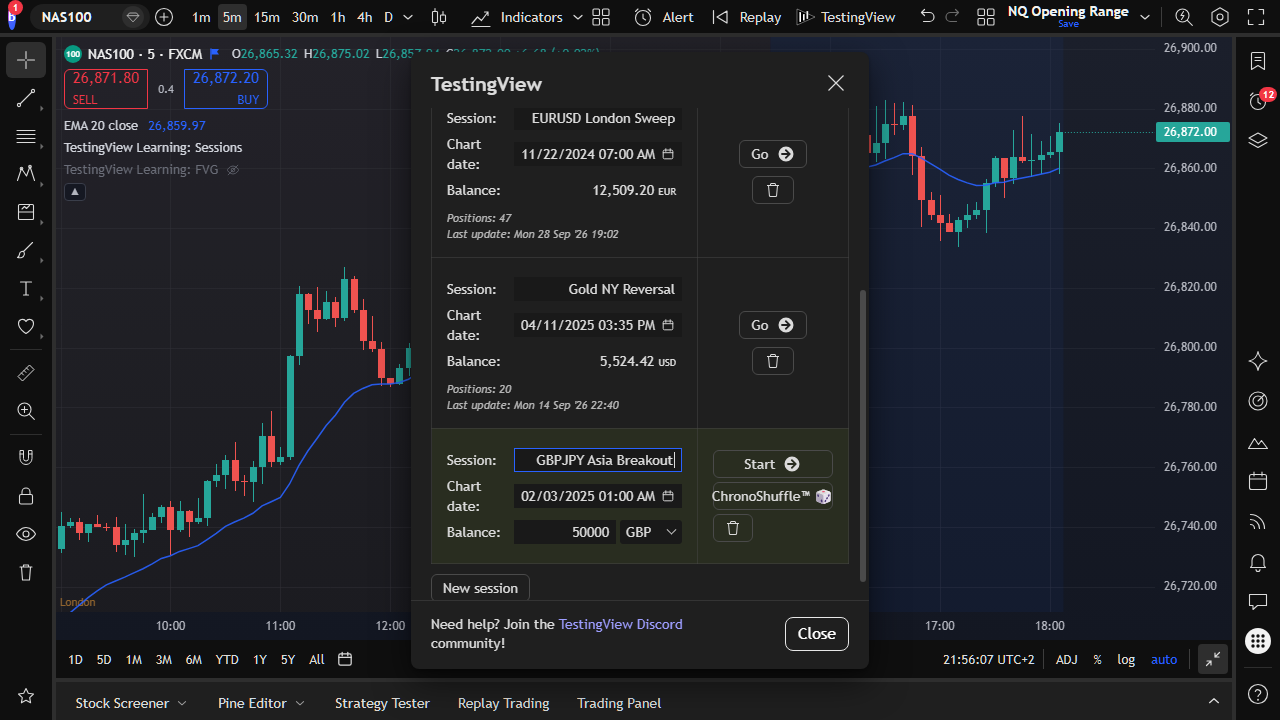
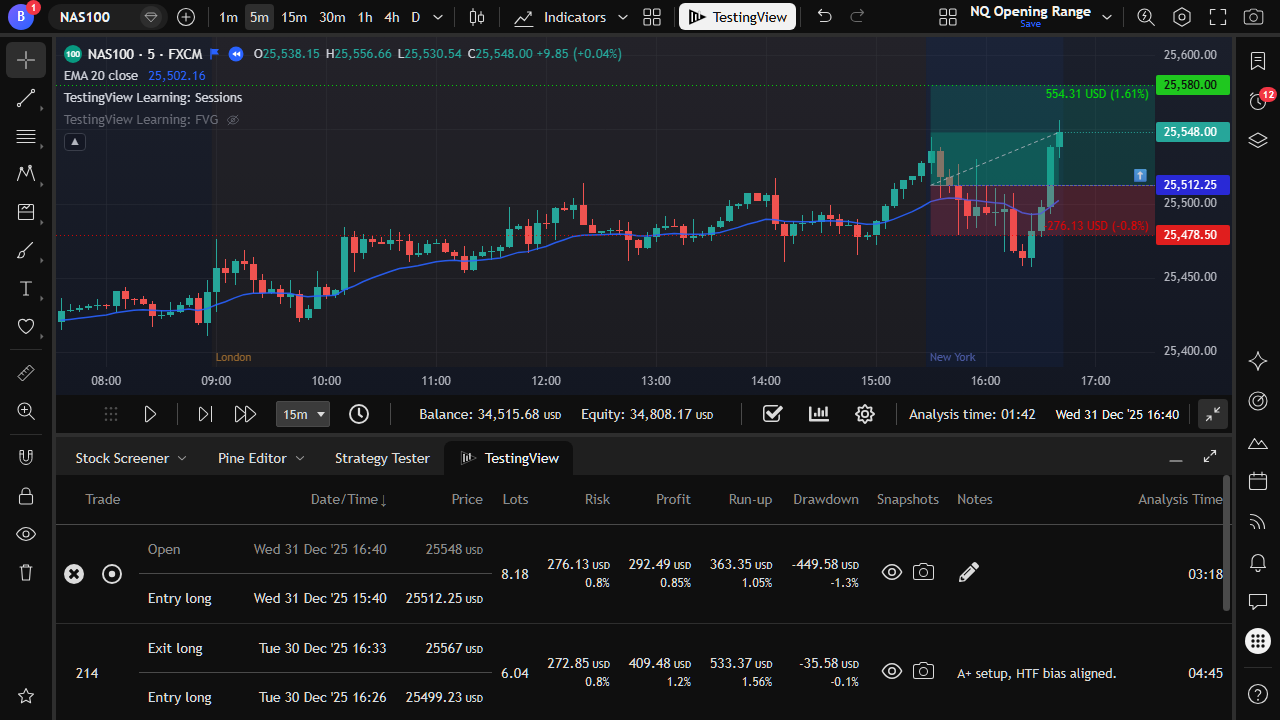
Open a session. Place the trade.
Start historical replay and size a position with live risk lines.
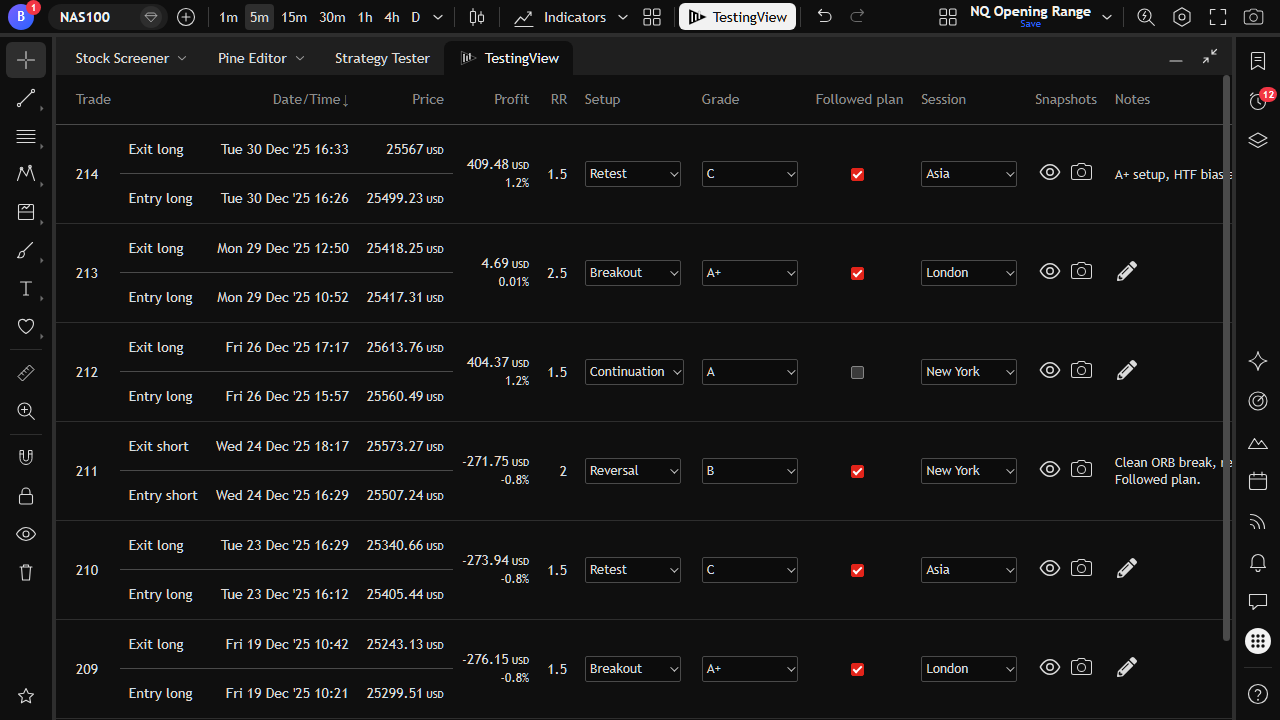
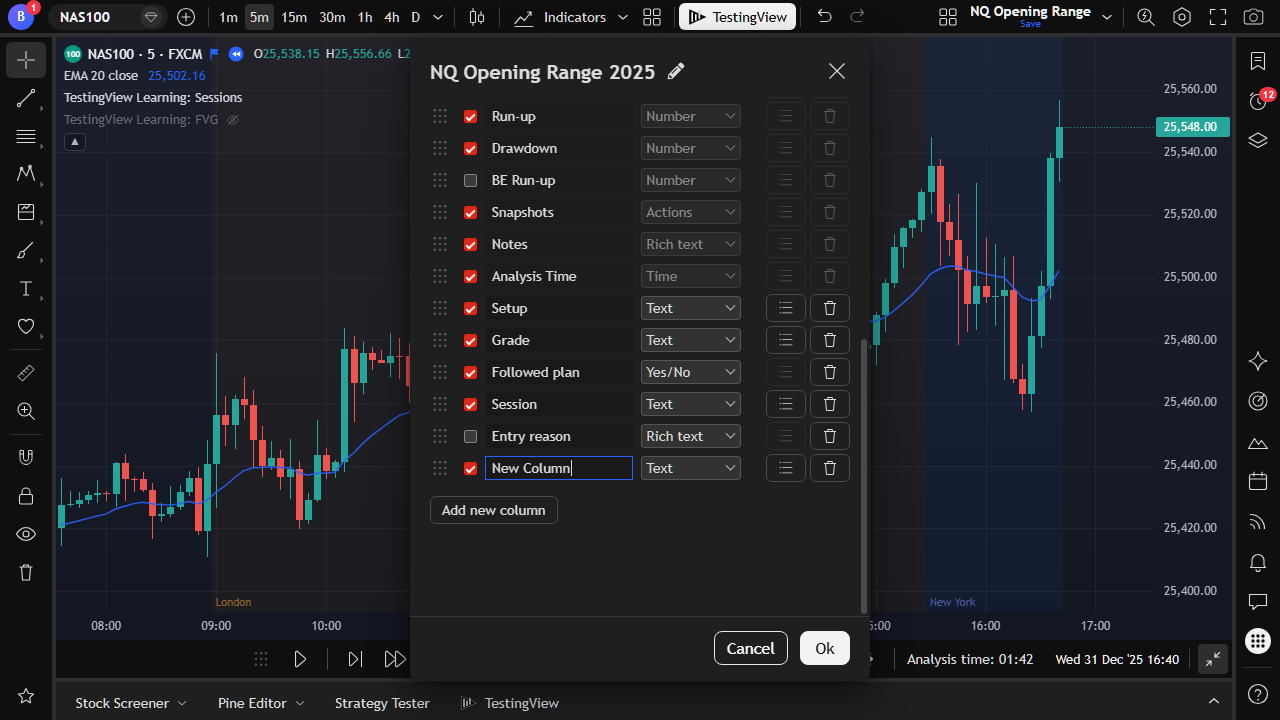
Track every trade. Shape your columns.
Log setups, grades, and notes. Then customize what you measure.
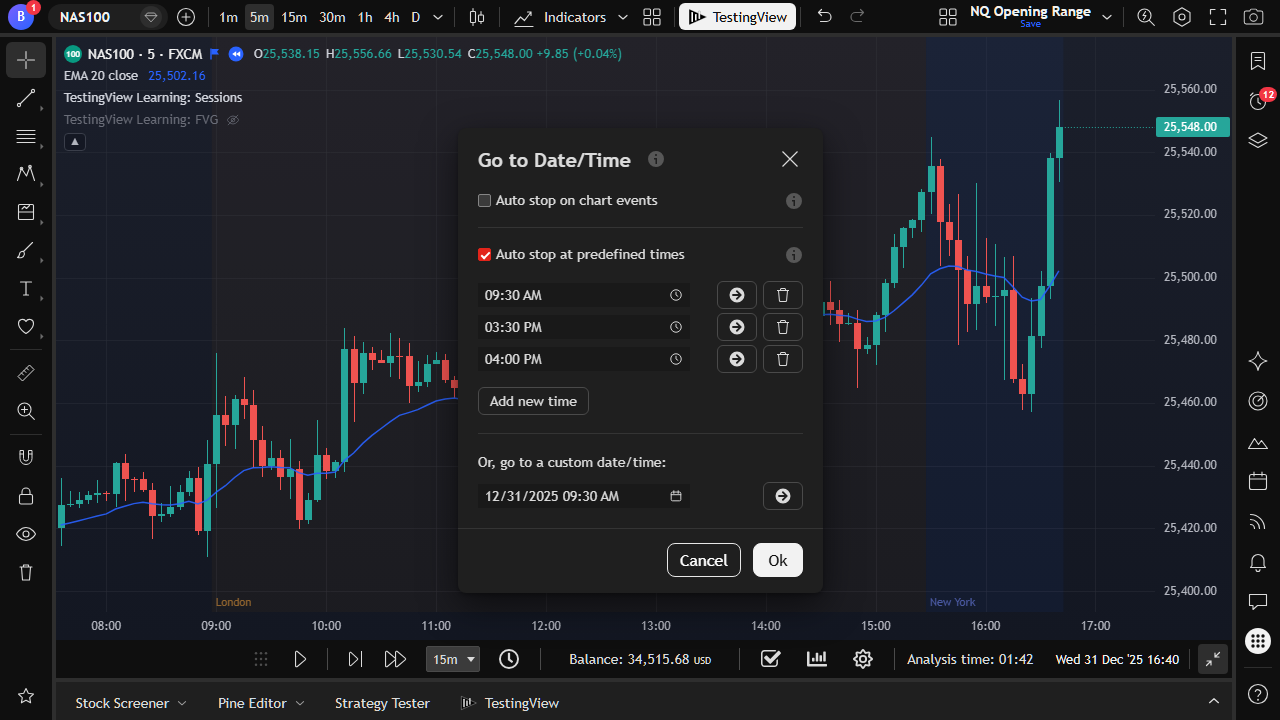
Jump to your session every day.
Save preferred times such as London open or NY cash open. Land there instantly.
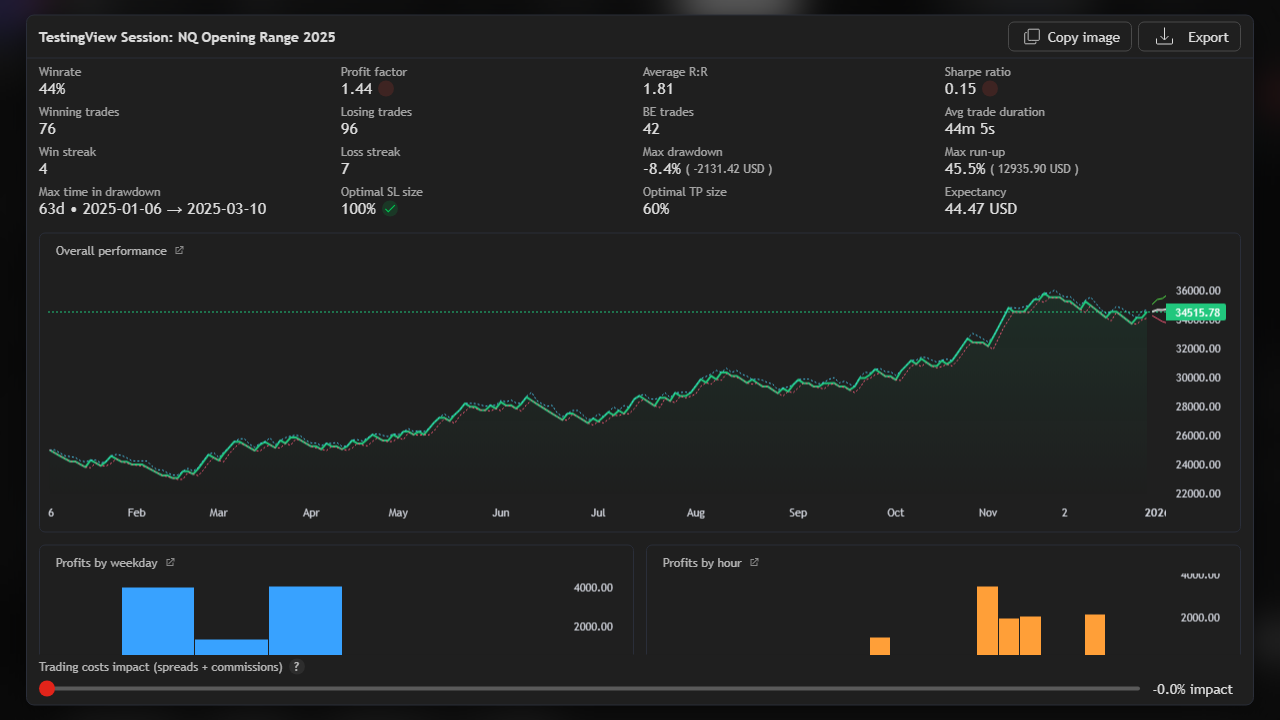
See the edge in the numbers.
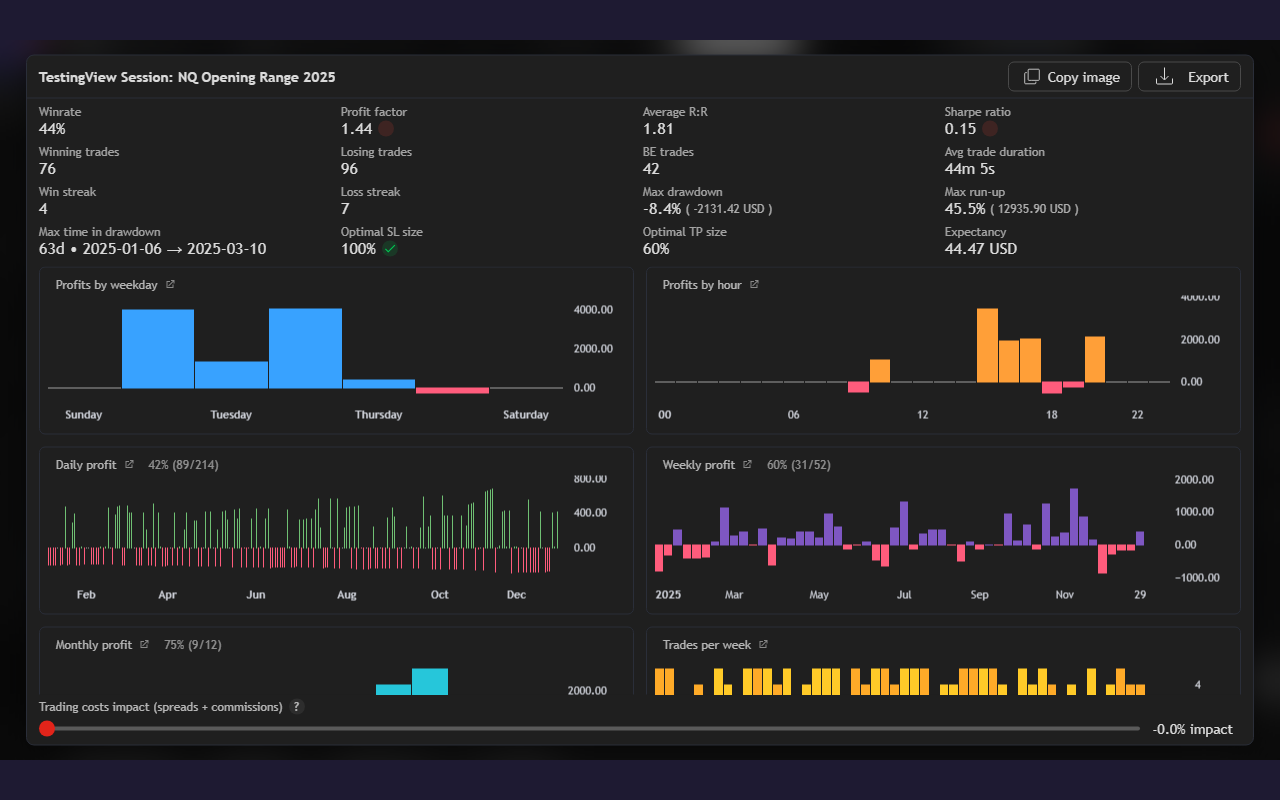
Win rate, drawdown, expectancy, and profits by hour sit in one view.
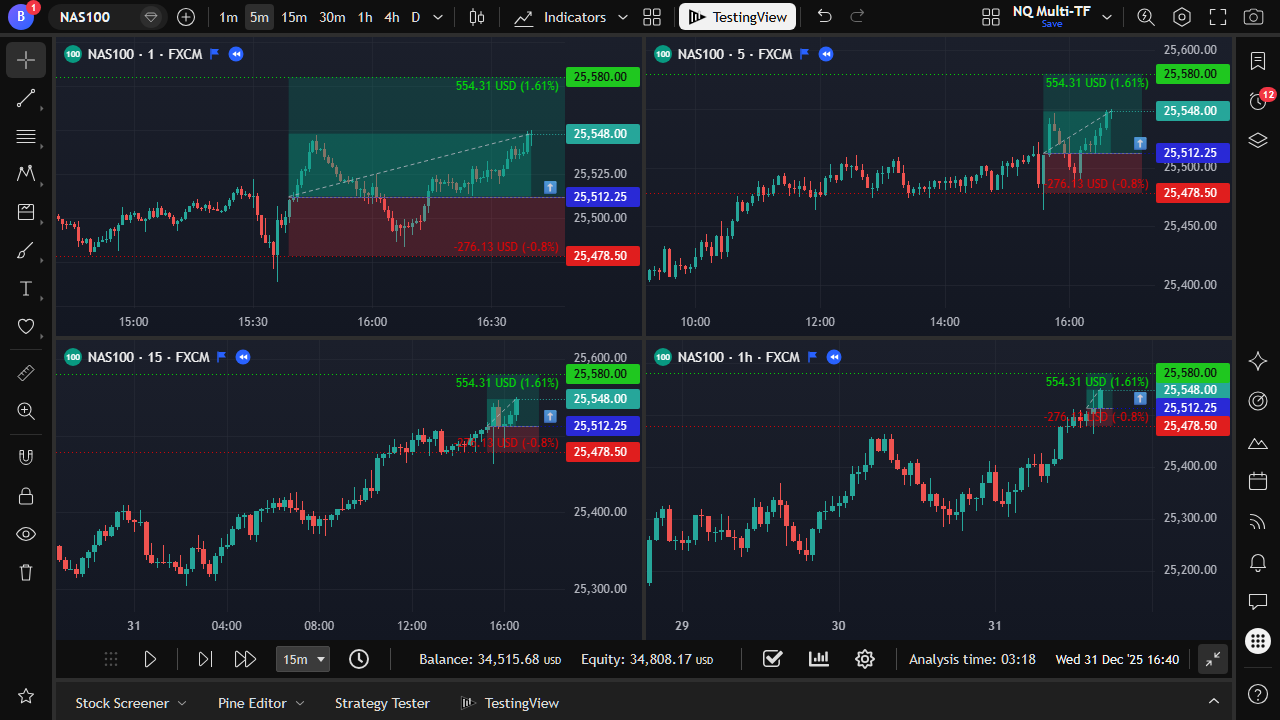
Multi-chart layouts. One playback.
Candles advance together across the charts in your layout.
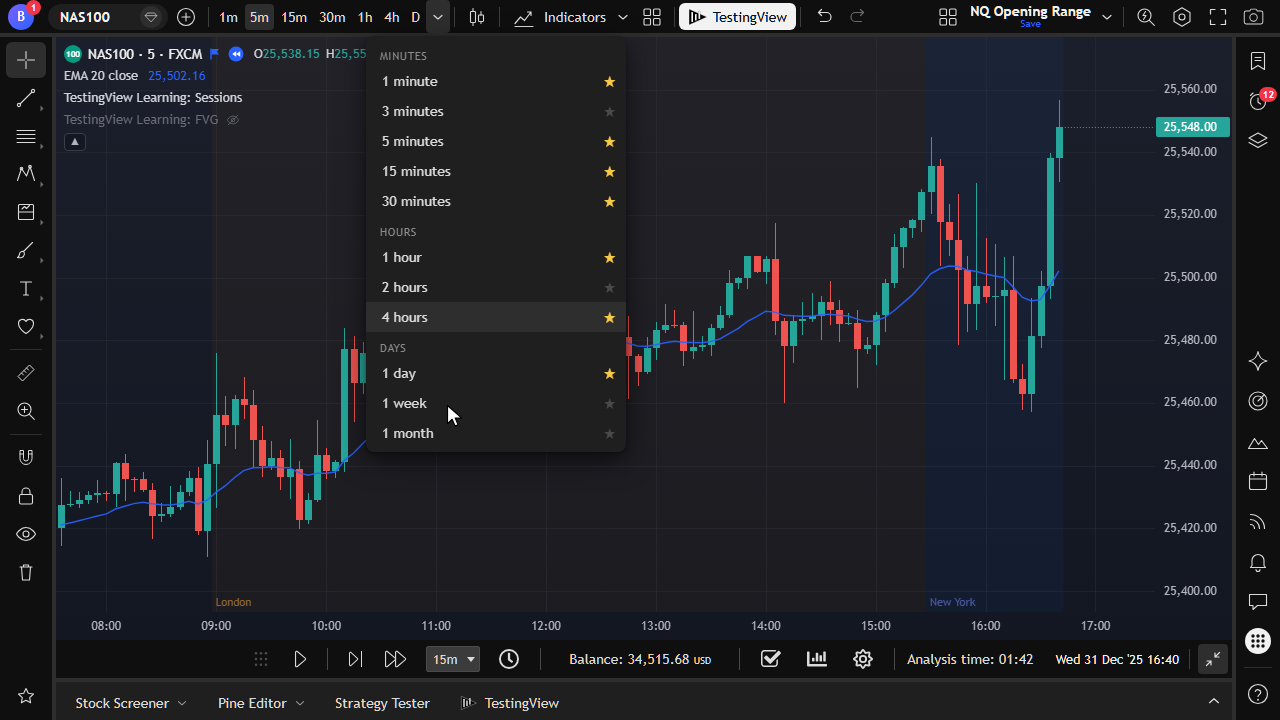
Switch timeframes without breaking replay.
The chart context stays stable while you move from minutes to hours mid-session.
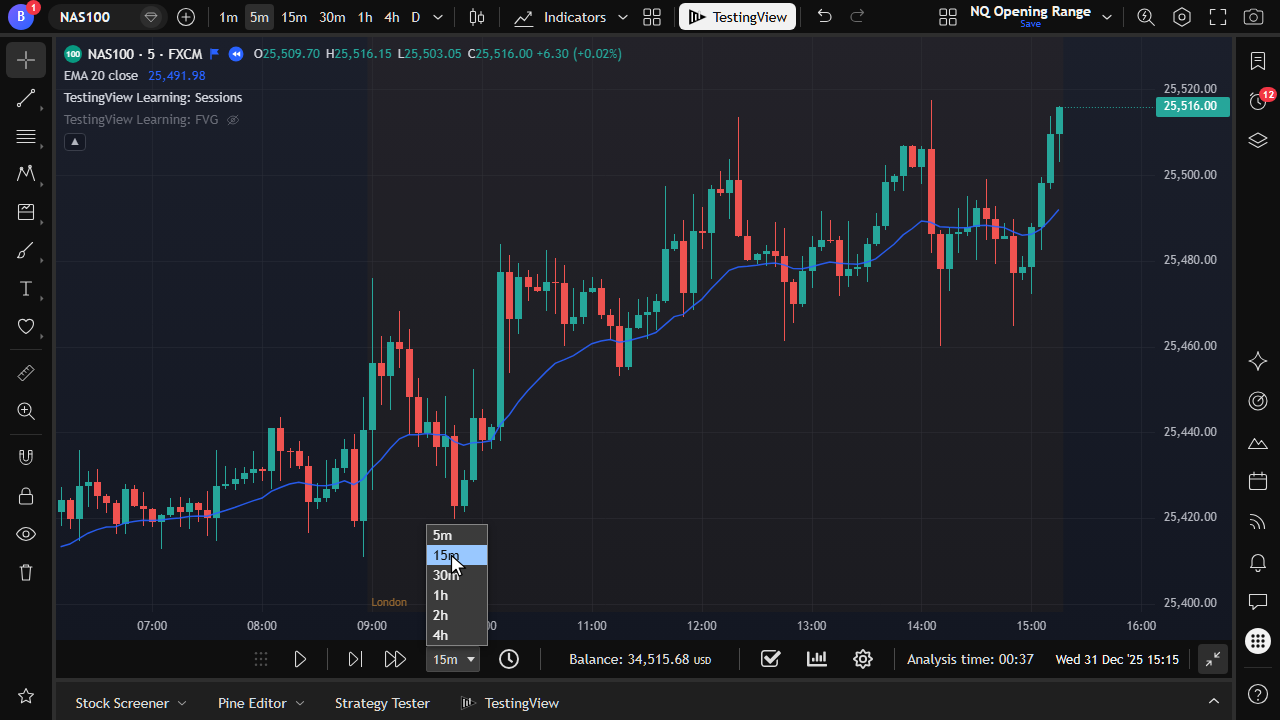
Fast-forward by the interval you want.
Step 5m, 15m, or 1h. Skip quiet periods and keep the simulation honest.
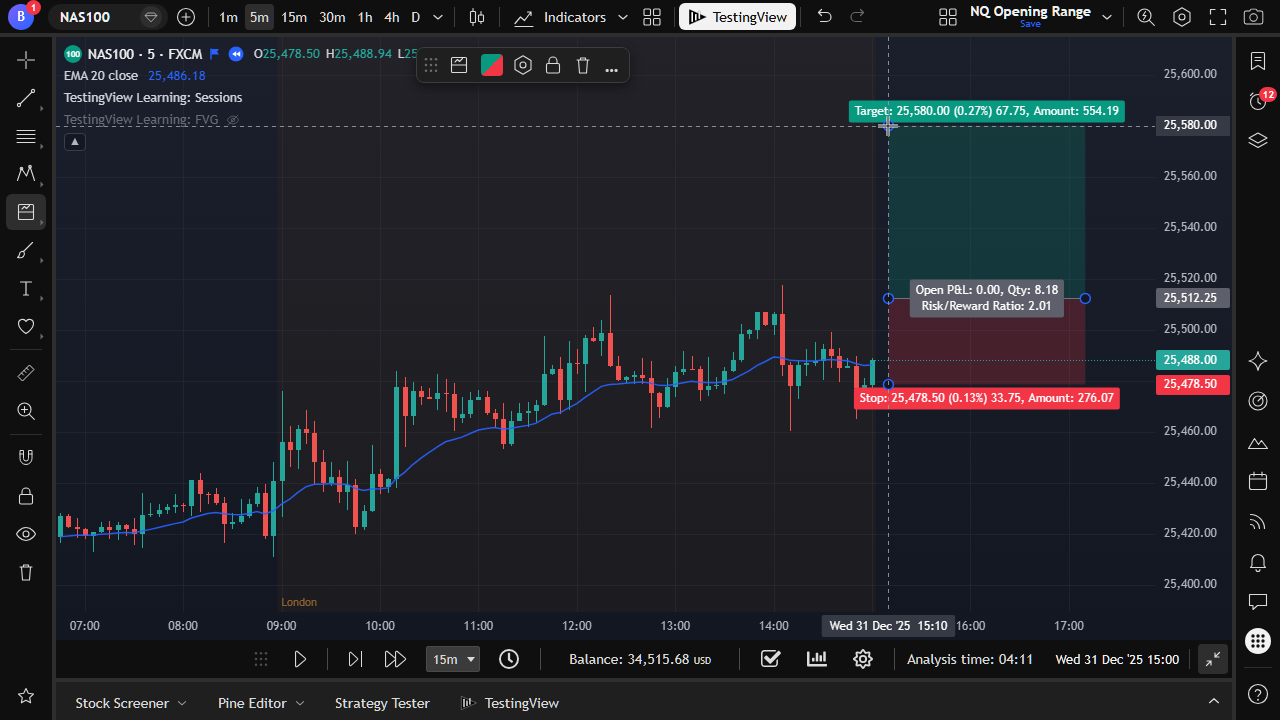
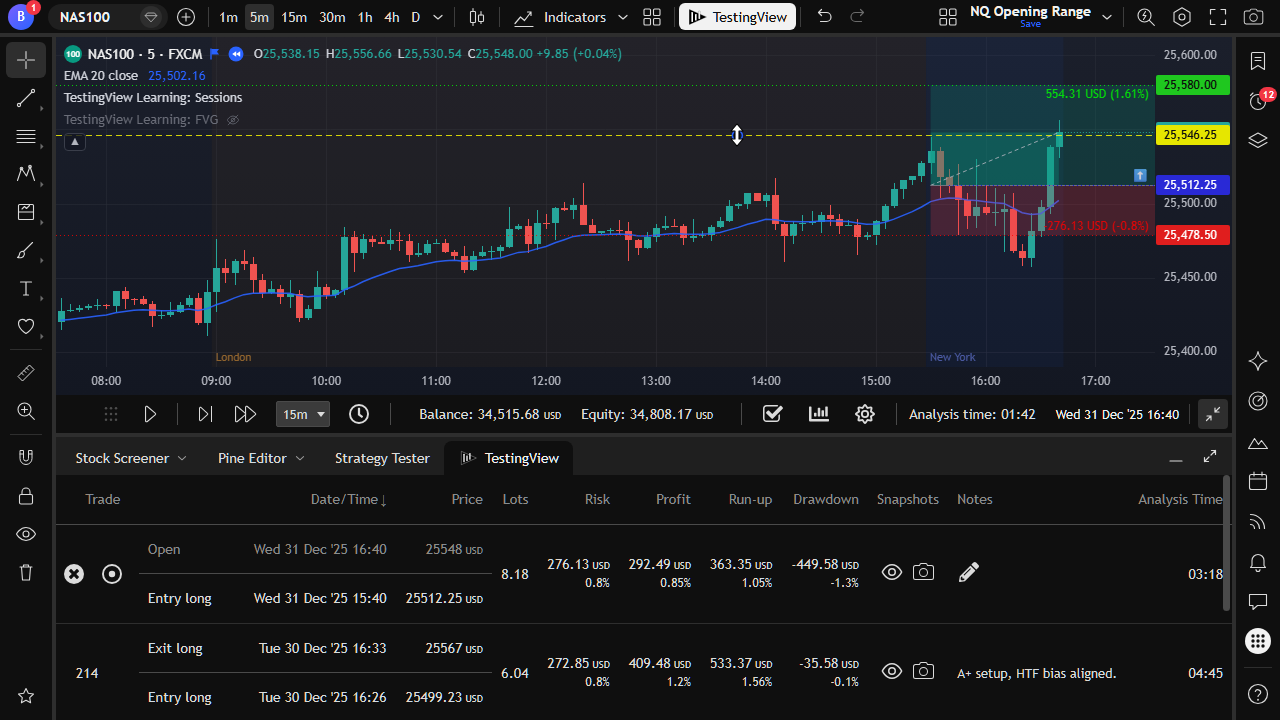
Move SL and TP while the trade is live.
Drag risk lines during replay. Practice management the way you trade.
Sessions · Journal · Stats · Sync · Time control
Extend TradingView with measurable strategy testing. Keep your own indicators on the chart while you backtest. Practice entries, stops, targets, and decision-making inside TradingView with sessions, tick and intrabar simulation, ChronoShuffle random starts, and playback that keeps future candles hidden. Explore all features.
Size entries with stop loss, take profit, and risk controls that are tied to your session capital.
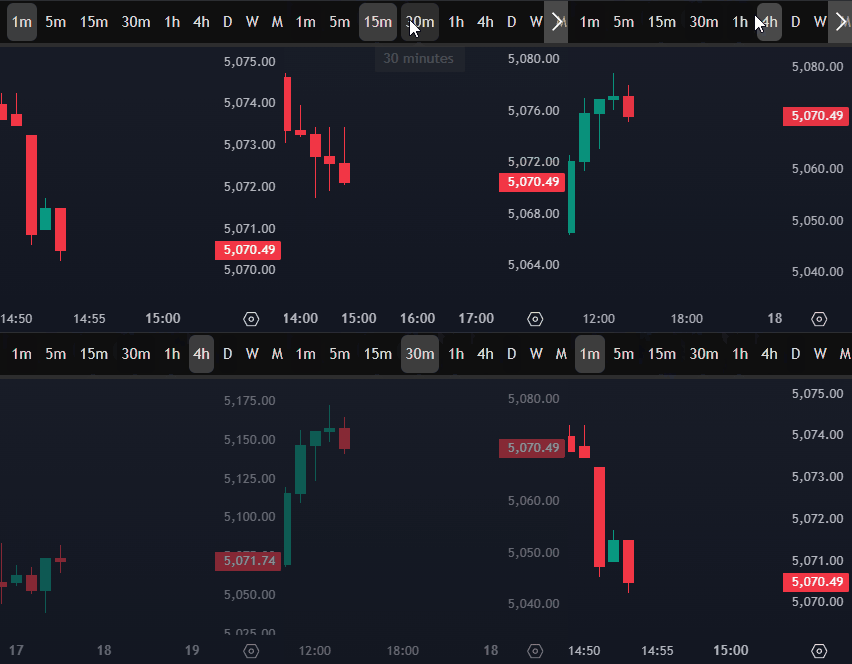
Switch chart intervals without breaking the session or revealing unfinished candles.
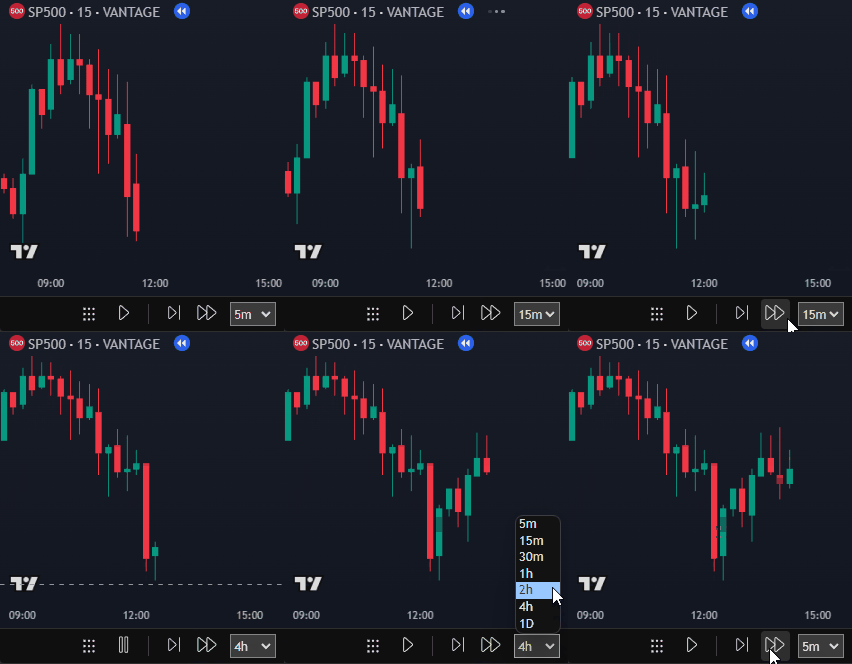
Step, fast-forward, and run tick-by-tick or intrabar simulation through historical candles on TradingView.
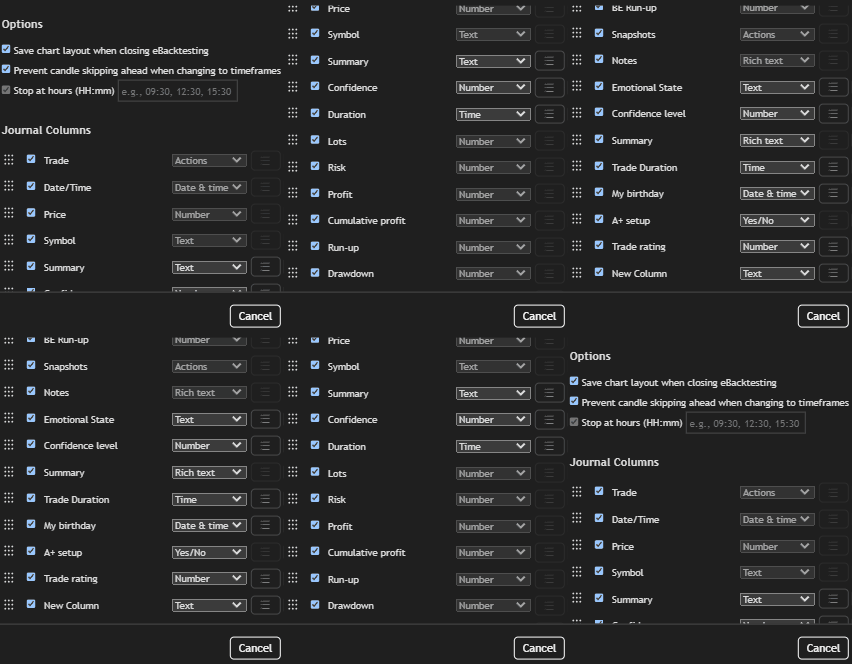
Track backtested trades with notes, snapshots, custom columns, and Excel export on supported plans.
TestingView supports honest historical practice on TradingView. That includes replay integrity, execution realism, and statistical validation.
Use random starting points, reliable future-candle concealment, and protection against look-ahead bias.
Model slippage, spreads, commissions, partial fills, and intrabar order handling.
Run synchronized replay with correct higher-timeframe data availability.
Use Monte Carlo analysis, out-of-sample testing, and confidence intervals.
Compare rule variations across identical historical samples. Keep your own TradingView indicators on the chart while you test.
Script repeatable tests, bulk-run scenarios, and access results programmatically.
Start free with session resume and core backtesting. Upgrade for higher trade limits, break-even, advanced stats, export, and multi-session workflows.
Here are top questions about TestingView. Browse the full knowledge base.
TestingView is a backtesting tool that runs on top of TradingView. It adds backtesting session management, simulated position tracking, risk sizing, a journal of backtested trades, snapshots, statistics, and safer candle playback controls.
TestingView can work with the TradingView replay features available on your TradingView account. If your TradingView plan does not allow replay on lower timeframes, TestingView cannot unlock that limitation.
The current product plans are Starter, Explorer, and Trader.
Open TradingView, click the TestingView toolbar button, then create a new session or resume an existing one.
Start or resume a session, draw a TradingView Long Position or Short Position tool, set entry, stop loss, take profit, and risk/size, then play candles. When price reaches the entry, TestingView opens and tracks the simulated trade.
Yes. TestingView supports TradingView multi-chart layouts. This is useful for watching multiple timeframes side by side instead of constantly switching chart intervals.
TestingView tries to keep the session date stable. If Prevent Candle Previews is enabled, it may navigate to a safer completed candle and advance forward to avoid revealing unfinished higher-timeframe candle information.
TestingView adds play/pause, step forward, fast-forward, skip interval selection, Go to Time, review mode, settings, statistics, and session balance/equity controls.
TestingView can show metrics such as profit, win rate, profit factor, average RR, drawdown, run-up, expectancy, streaks, equity curve, returns, and other performance charts. Some advanced statistics depend on your plan.
Yes. If your account page allows username changes, update the TradingView username there so access is linked to the correct TradingView identity.